Showing posts with label Modeling. Show all posts

February 3, 2012

Use of Aggregates,Compression, Roll Up and Partitioning in SAP BI


Aggregates:

Aggregates are used to improve query performance. Say you have cube with 30 characteristics and everytime you run query on this cube, it is hitting 10 characteristics frequenty.

So to improve the query performace create Aggregate on those characteristics. Instead of seraching for data in Cube, query will hit the Aggregate first.

Compression:

As we all know, we have two tables in info cube for transaction data(F-table and E-Table). F-table will store facts data and E-table will store compressed data. COmpression also used to improve the query performance and loading performance.

Query Performance:

Compression is nothing but removing request number an aggregating key figure values based characteristics data. We can get same sales documnet in different request(lets assume we got same sales document 5 times into cube in different request). When we compress it will become one record based on sales document number, so when we execute query system has to pick only one record instead of 5 records. this will improves query performance.

Loading Performance:

It is recommended to delete and re-create the index when we load the data into cube. Deleting index will delete the index for data in Ftable and re-creates. If you have huge uncomressed data in cube(F-table is high), delete and create index steps will take log time to complete.

Roll Up:

This is nothing but updating the lastest transaction data to aggregates which is loaded to Info Cube (if you have any aggregates on cube).

Partitioning:

This is also used to improve the query performance and we can do partitioning in two ways

i) Logical partitioning

ii) Physical partitioning(database level partitioning)

refer below links for clear information about partitioning.


Hope it helps...

February 2, 2012

Why Navigational attribute work as characteristic in Reporting and Modelling in SAP BI


We all know that Fact table is surrounded by dimension table and master data in connected to dimension tables using SID's.

So any master data object which has SID can act as characteristic in reporting or in Cube.

If you add an attribute to any characteristics, we know what are all the tables will generate.

Display time independent -- P Table

Display time depended -- Q Table

Navigational time independent -- X Table

Navigational time dependent --- Y table.

If you check P and Q table in BI system, it will not contain SID values. But if you check X and Y values, it will contain SID values for this characteristic and we will have SID values of main characteristic(to which this is navigational attribute).

The following figure illustrates the relationship between X table and the SID table of navigational attribute

Let’s take we have defined LOCATION as navigational attribute for 0CUSTOMER.


As navigational attributes contains SID values, it will act as characteristics in reporting and Cube.

you can refer the below document for characteristic tables structure.

http://www.sdn.sap.com/irj/scn/go/portal/prtroot/docs/library/uuid/10db929a-7abb-2e10-6fa5-d8d45ca028ed?QuickLink=index&overridelayout=true

Hope it helps..

January 22, 2012

Difference between Display and Navigational attribute

We will see the differences in 2 areas.

1) Modelling:

Values of Display attributes will store in P and Q tables.

P -- Display time independent attributes.
Q -- Display time dependent attributes.


Values of Navigational attributes will store in X and Y tables.

X -- Navigational time independent attributes.
Y -- Navigational time dependent attributes. 

2) Reporting:

As we all know drill down in report is possible if the characteristic is navigational attribute and is not if it is display attribute.Now we will see this with some example data.

Lets consider we have objects Customer, country and sales amount. we have the below data.

Customer   country    Sales amount

Cust1          India          200
Cust2          India          300
Cust3          USA           500
Cust4          USA           400
Cust5          UK             600
Cust6          USA           100

Navigational Attribute:

Assume that Country is as navigation attribute to master data Customer. If we want to have an analysis about the sales based on country. Since 'Country' is navigational attribute we have an independent drill down of Country with out the support of Customer in report .

country   Sales amount

India             500
USA             1000
UK                 600

here country is an attribute of customer, as we made this as navigational attribute, it can be standalone in report with out customer.

Display Attribute:

We cannot go for individual drill down to country with out customer, i.e if we want country in our report then we have to drill down customer along with country. Report output will be as below.

Customer  country   Sales amount

Cust1        India           200
Cust2        India           300
Cust3        USA            500
Cust4        USA            400
Cust5        UK              600
Cust6        USA            100

Just observe the report in our first case is having only three records with aggregated value based on country but in the second we have 6 records.

Hope we get clear idea about display and navigational attributes.

January 1, 2012

About Non-Cumulative key figures

This document explains about the basics of non-cumulative keyfigures, how create non-cumulative key figures and how the values will be calculated for non-cumulative key figures at run time.

Basics of Non – Cumulative Key Figures

December 24, 2011

Validity Table in SAP BW/BI

Validity table stores the characteristic values for which non cumilative keyfigures are valid. Non cumilative key figures are objects that are always in relation to a point in time and are not simply summarized.

This comes in picture when you are creating info cubes for inventory management.

The below documnets explians the step by step procedure to maintain validity table for non cumilative key figures.

Validity Table in SAP BW/BI

creation of multiple characteristics and key figures in one click

Do you know that we can create multiple characteristics and key figures in one click?


All you need to do for this is create an ABAP program using SE38 and create custom t-code for this program in SE93.


Now prepare your excel file with list objects you want to create and select the infor area to which you want to assign this objects.


For step by step procedure refer the below document and you have code as well.


Wrapper Tool for Creating Multiple Info Objects in one go

December 14, 2011

Scheduling options in Process chains.


Different types of Scheduling option in Process Chain:

While Scheduling a Process Chain, there are two options:

The start process is set to Direct scheduling:

  • BI_PROCESS_TRIGGER is released with configured start options.
  • Subsequent application processes are scheduled and released as event triggered jobs.

The start process is set to Start Using Meta Chain or API:

  • No BI_PROCESS_TRIGGER is scheduled or released. You have to start the process chain via another process chain or API (Function module: RSPC_API_CHAIN_START). This provides flexibility to schedule process chains with the help of a driver ABAP program.
  • Subsequent application processes are scheduled and released as event triggered jobs.
  • In this case Change Selection option will not be there.

 Scheduling scenario for Direct scheduling:

 Scheduling a Process Chain on a particular day of every Month

1)  Suppose we want to schedule a Process chain on 1st of every month:

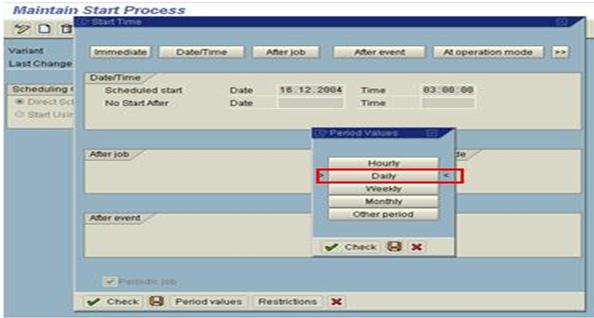
Open the Chain in Planning mode (RSPC or RSPC1) >> Right click on the Start Process >> Display variant >> Change Selections >> Click on Date/Time tab >> there click on Periodic Values Tab


Click on Periodic Values Tab >> There click on Monthly.

Check and Save.
In the Schedule Start date field enter 1st date of the present month.
Then the chain will run on first of every month.


 Schedule a process chain at different times during the day

Suppose we need to run a Process Chain twice a day daily at two different timings X and Y.
Open the Chain in Planning mode (RSPC or RSPC1) >> Right click on the Start Process >> Display variant >> Change Selections >> Click on Date/Time tab.
There in the Scheduled start field give the date when the Chain is going to run for the first time and enter the time in the Time field as X.
Then click on the Periodic value tab and Click on Daily.


Then Check and Save, again Check and save.
Activate and Schedule the Chain.

Now right Click on the Start Process >> Display Scheduled Jobs >> there you will find one Release Job (BI_PROCESS_TRIGGER) >> Select the Job >> In the top JOB tab >> Click on it and select Repeat Scheduling.


There Click on Date/Time tab, maintain the date and enter time as Y. Select Periodic Job Check Box >> Check and save. Then come out and you  will find that the Start Process is in red color. It means that the Process chain is scheduled for multiple times i.e. it has more than one Release Job.

Suppose you want to run the chain 5 or 6 times a day,you can do it in this way or you can do it in another way.

Create an Event in SM62.
Then go to SM36 Give a Job name >> Then click on Steps >> Click on ABAP Program >>Give the Program name BTC_EVENT_RAISE >> In the Variant Field Enter the Event created in SM62 >> Check and Save.


Then click on the Start Condition >> Click on Date/Time tab >> Give the date and give the first time.
In this way create 5 different Jobs by giving 5 different timings.
Maintain this Event in the Start condition of the Process chain.

Note: BTC_EVENT_RAISE is available in BI 7.0, for BW 3.X create a Program using function module "BP_EVENT_RAISE" and pass the event name as parameter. Save this as variant.

Check SAP Note : 919458 for Documentation.

Schedule a Process Chain to run only for X number of days of a month

Suppose we need to run a Process chain every first 15 days and Last two days of every month.

In this case, create a Factory Calendar using T-code SCAL. There declare first 15 days and Last two days as Working days and rest all as Holidays.
Right click on the Start Process >> Display variant >> Change Selections >> Click on Date/Time tab >> Click on the Restriction tab (F6) >> there maintain the Calendar id and Select Do not Execute on Sundays or Holidays>> Then Check and Transfer >>Then in the Scheduled start field give the date when the Chain is going to run for the first time.

Then the Process chain will only run as per the above requirement.....


Trigger Event at R/3 to BW side:

Suppose we want to Schedule a Process chain as event based. This event will be trigger from R/3 to BW:

In BW System:
1. Create New Z-Program with Parameters Event Id, Event Parameter and In the Code Use BP_EVENT_RAISE Function raise Event with Parameter. Create Transaction ZEVENT for this Program.
2. Create Process Chain to Load Data from R/3 to BW.
3. Schedule this process chain after the Event and parameter. Activate and Schedule this process Chain.
4. Now Run SHDB to Create BDC code for this Transaction 'ZEVENT' with Parameters of Event and Event parameters.
Now BW is ready to Load after

In R/3 System:
1. Call Function RFC_CALL_TRANSACTION with 'ZEVENT' Transaction and BDC Table with Correct Event and Parameter. Use Destination as your BW System.
2. Check SM59 for BW Connection.
This Function Execute the Transaction in BW system. That will raise the Trigger required and that will Start the Process Chain and Load the Data.

December 12, 2011

December 8, 2011

Line Item Dimension and High Cordinality


1)  Line item: This means the dimension contains precisely one characteristic. This means that the system does not create a dimension table. Instead, the SID table of the characteristic takes on the role of dimension table. Removing the dimension table has the following advantages: When loading transaction data, no IDs are generated for the entries in the dimension table. This number range operation can compromise performance precisely in the case where a degenerated dimension is involved. A table- having a very large cardinality- is removed from the star schema. as a result, the SQL-based queries are simpler. In many cases, the database optimizer can choose better execution plans. Nevertheless, it also has a disadvantage: A dimension marked as a line item cannot subsequently include additional characteristics. This is only possible with normal dimensions. We recommend that you use Data Store objects, where possible, instead of Info Cubes for line items. See Creating Data Store Objects. 
2) High cardinality: This means that the dimension is to have a large number of instances (that is, a high cardinality). This information is used to carry out optimizations on a physical level in depending on the database platform. Different index types are used than is normally the case. A general rule is that a dimension has a high cardinality when the number of dimension entries is at least 20% of the fact table entries.
The size of the dimension tables should account for less than 10% of the fact table. If the size of the dimension table amounts to more than 10% of the fact table, mark the dimension as a line item dimension.
The line item flag in dimension: 
- You can flag it for a dimension having only one characteristic
- when this indicator is flagged, no dimension table will be created. This means that when you will filter on this char in a report, the system will directly access your Info Cube fact table instead of first going to the DIM and then JOIN the fact table.
When you'll drilldown this char, the same, no need to JOIN the DIM table since your char SID is stored directly in the fact table.
During loading, the same again; no need to check and generate DIMID for this characteristic --> shortens the loading time.


- When to flag it: you need to estimate what will be the ration "Number of different Values of the char posted" / "Total number of records posted".
For example; one record is posted to a cube for each Document Number. In this case the ratio is 100%, you can flag the dim as Line Item.
Imagine now that you are posting the document and its items and you can say that you have in average 10 items per documents. The ratio for your document number characteristic is 1/10 = 10%. In this case you shouldn't flag it because filtering for document numbers will much faster via the DIM table than directly from the FACT (much more records to scan to find it).


December 6, 2011

Types of attributes in SAP BW


In SAP BW, we have three types attributes they are

1) Display/Exclusive Attributes
2) Navigational Attribute
3) Transitive Attribute.

Attribute: 
Attributes are Info Objects that exist already, and that are assigned logically to the new characteristic

Navigational Attributes: 
A Navigational Attribute is any attribute of a Characteristic which is treated in very similar way as we treat as Characteristic while Query Designer. Means one can perform drilldowns, filters etc on the same while Query designing.

Imp Note:
1)While Creating the Info Object -->Attributes Tab Page -->Nav. Attributes to be switched on .
2)While Designing the Cube, we need to Check mark for the Nav. Attributes to make use of them.

Features / Advantages
1)Navigational Attributes acts like a Characteristic while Reporting. All navigation functions in the OLAP processor are also possible
2)Filters, Drilldowns, Variables are possible while reporting.
3)It always hold the Present Data .
4)Historic Data is not possible through Nav. Attributes.
5)As the data is fetching from Master Data Tables and Not from Info Cube.

Disadvantages:
1)Leads to less Query Performance.
2)In the enhanced star schema of an InfoCube, navigation attributes lie one join further out than characteristics. This means that a query with a navigation attribute has to run an additional join
3)If a navigation attribute is used in an aggregate, the aggregate has to be adjusted using a change run as soon as new values are loaded for the navigation attribute.

For more reference, check the below link

Transitive Attributes
A Navigational attribute of a Navigational Attributes is called Transitive Attribute.
If a Navigational Attribute has the further more Navigational Attributes ( as its Attributes ) in it those are called Transitive Attributes .

Example: Consider there is a characteristic ‘Material’ .It has ‘Plant’ as its navigational attribute. ‘Plant’ further has a navigational attribute ‘Material group’. Thus ‘Material group’ is the transitive attribute. A drilldown is needed on both ‘Plant’ and ‘Material group’.
And again we need to have both Material & Plant in your Info Cube to Drill down. (To fetch the data through Nav. Attributes. We need Master Data tables hence, we need to check mark/select both of them in the Cube)

For more reference, check the below link 

If Cube contains both ‘Material’ and ‘Plant’
Dimension table having both ‘Material’ and ‘Plant’ will have DIM ID, SID of Material, and SID of Plant. Since both the SID’s exists reference of each navigational attribute is made correctly.

If Cube contains only 'Material’
Dimension table having only ‘Material’ will have DIM ID, SID of Material. Since SID for first level navigational attribute (Plant) does not exists, reference to navigational attribute is not made correctly.

Exclusive Attributes / Attributes Only/ Display Attribute: If you set the Attribute Only Indicator (General tab page for Chars / Additional Properties tab page for Key Figs) for Characteristic while creating, it can only be used as Display Attribute for another Characteristic and not as a Nav. Attribute.

Features:
1)And it cannot be included in Info Cubes
2)It can be used in DSO, Info set and Char as Info Providers. In this Info Provider, the characteristic is not visible during read access (at run time)
3)This means, it is not available in the query. If the Info Provider is being used as source of Transformation or DTP the characteristic is not visible.
4)It is just for Display at Query and cannot be used for Drill downs while reporting.

Exclusive attributes:
1)If you choose exclusively attribute, then the created key figure can only be used as an attribute for another characteristic, but cannot be used as a dedicated key figure in the Info Cube.
2) While Creating Key Figure àthe Tab page: Additional Properties àcheck Box for Attribute Only

For more information, check the below link

Step by Step Guide to create DSO

The below article give you the step by step procedure to create DSO in SAP BI.


Step by Step Procedure for DSO Creation

Everything about Data Store Object(DSO)

In SAP BI 7.0, we have three types of DSO's they are 


1) Standard DSO
2) Direct Update DSO
3) Write Optimized DSO


The below three articles will give clear information about these three DSO's. It give information about the difference between DSO's and activation process in standard DSO.


Check the below articles
UNDERSTANDING DSO (DATASTORE OBJECT) PART 1: STANDARD DSO
UNDERSTANDING DSO (DATASTORE OBJECT) PART 2: WRITE-OPTIMIZED DSO
UNDERSTANDING DSO (DATASTORE OBJECT) PART 3: DIRECT UPDATE DSO

December 5, 2011

Why Data Transfer Process (DTP) over Info Package (IP) in SAP BI 7.0

This document will give you the clear picture about why DTP has chosen in BI 7.0 instead of Info Package.
Why Data Transfer Process (DTP) over Info Package (IP) in SAP BI 7.0

NEW FUNCTIONALITIES FOR DATA TRANSFER PROCESS IN SAP BW 7.3


we have got some of the very good features in SAP BW7.3 for Data Transfer Process.


Please check out the below article
NEW FUNCTIONALITIES FOR DATA TRANSFER PROCESS IN SAP BW 7.3

Multi Provider Creation Based on Sales and Planning Info Cubes


In This article, I am going to explain the advantages of Multi Provider and scenarios where Multi Provider creation is recommended. This article will give you steps by step procedure to create Multi Provider.


Please go through the below document
Multi Provider Creation Based on Sales and Planning Info Cubes